Evaluate DePIN Node VPS Specs to Avoid Slashing Penalties
A DePIN node with 99.5% uptime is not “mostly fine” if the reward tier expects >99.9%. That gap is 3.6 hours of additional downtime per month.
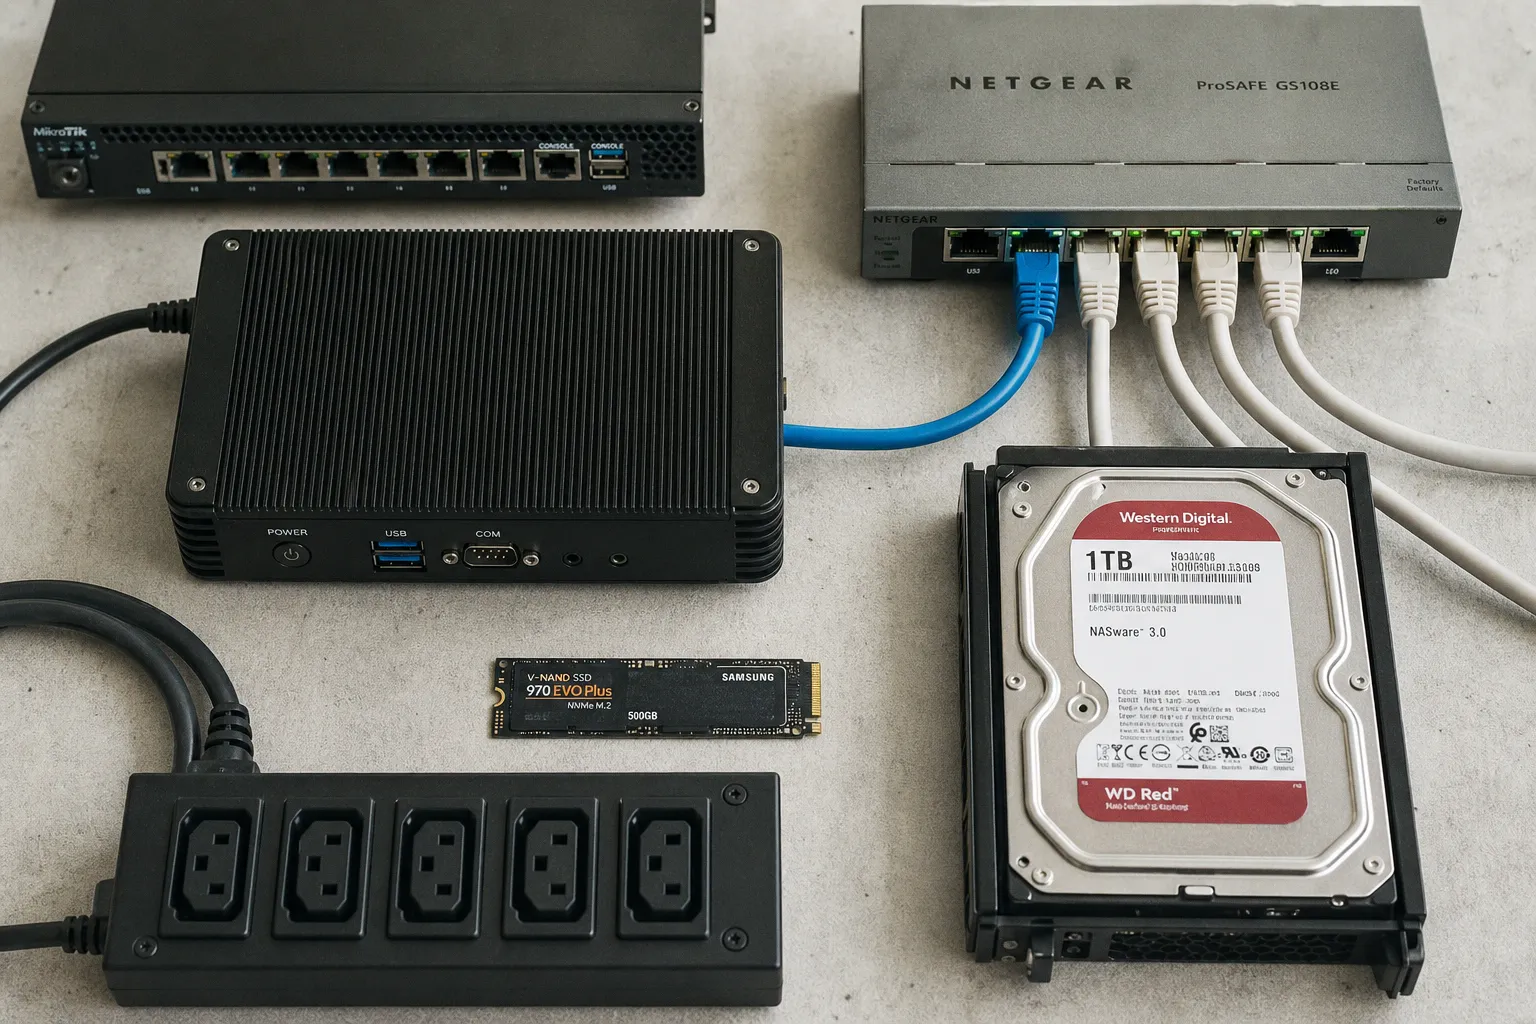
The question is not whether a VPS can boot the node software. Most can. The question is whether the VPS can sustain the node’s workload under consensus, proof, bandwidth, and latency constraints. That is the real audit surface. If you are asking how to check evaluate DePIN node VPS specs to avoid slashing, the answer starts with measurable infrastructure properties: dedicated CPU, RAM headroom, NVMe I/O, unmetered bandwidth, latency below the network’s practical threshold, and monitoring that fails before the protocol does.
The Anatomy of Slashing: Why Hardware Performance Becomes a Penalty Event
Slashing is not one mechanism. It is a class of penalties. DePIN networks use it, or adjacent reward reductions, to punish behavior that damages the network’s service layer. The trigger depends on the project. The pattern is consistent.
Common penalty vectors include:
1. Prolonged downtime.
The node stops responding. Heartbeats fail. Proof windows are missed. The network marks the operator as unreliable.
2. Failure to provide proof of service.
Storage nodes fail proof-of-spacetime or retrieval checks. Bandwidth nodes fail throughput verification. Compute nodes fail job execution or availability checks.
3. Malicious behavior.
Double-signing, forged proofs, invalid responses, or protocol-level abuse. This is not a VPS sizing issue. It is still part of the risk matrix.
4. Performance degradation below required thresholds.
The node remains “online” but cannot meet latency, disk, or bandwidth targets. This can reduce rewards or make the node ineligible for high-quality jobs.
The operator sees one machine. The protocol sees service reliability.
That distinction matters. A VPS dashboard can show “running” while the node is functionally dead to the network. CPU steal can spike. Disk I/O can queue. Packet loss can rise. A storage proof can time out. An AI-compute job can miss a deadline. The machine has not crashed. The economic position has.
A DePIN node is not audited by boot status. It is audited by whether it proves useful service inside the network’s timing window.
The first audit step is to map the protocol’s slashing conditions against the VPS failure modes. Do not start with the cheapest plan. Start with the punishment conditions.
| Failure mode | VPS symptom | Protocol consequence | Primary control |
|---|---|---|---|
| Downtime | Node process offline, kernel panic, provider maintenance | Missed heartbeats, reward loss, possible slashing | Uptime monitoring, restart policies, provider SLA review |
| CPU contention | High steal time, slow job execution | Failed compute tasks, lower assignment quality | Dedicated cores, CPU isolation, load alerts |
| RAM exhaustion | Swap use, OOM kills | Node crash, proof failure, database corruption risk | RAM headroom, swap monitoring, process limits |
| Disk bottleneck | High I/O wait, low IOPS, slow reads | Failed storage proofs, slow retrieval | NVMe SSD, benchmarked IOPS, disk queue alerts |
| Network instability | Packet loss, latency spikes, bandwidth caps | Missed proof windows, poor service score | 1Gbps+ port, unmetered transfer, low-latency region |
| Misconfiguration | Wrong ports, time drift, stale client | Invalid or missing service proofs | Configuration audit, NTP, automated updates with caution |
The exact slashing formula is project-specific. There is no universal DePIN penalty equation. Treat any claim of a standard formula as suspect. The correct method is to read the protocol’s operator documentation, identify the measurable service obligations, and then size infrastructure to maintain margin under load.
Dedicated Compute: The Noisy Neighbor Is an Attack Vector
Shared vCPU plans are attractive because the monthly cost is low. That is the entire argument for them. It is not a technical argument.
A shared vCPU is a scheduling promise, not a dedicated compute resource. Other tenants on the same host can consume cycles and cache. The result is the noisy neighbor effect: latency spikes, CPU steal, inconsistent execution, and unpredictable response times. For a static website, this is tolerable. For a node competing for compute jobs or proof windows, it is a direct attack vector against revenue.
Dedicated CPU cores reduce this surface. They do not eliminate provider risk. They remove one common source of nondeterminism.
For DePIN nodes, especially compute-oriented networks such as AI infrastructure or marketplace-style compute, the CPU audit should include:
- Dedicated cores, not just vCPU count.
“4 vCPU” on a shared plan is not equivalent to 4 dedicated cores. The node workload cares about sustained execution, not marketing arithmetic.
- CPU steal percentage under load.
On Linux, steal time indicates how long the virtual machine wanted CPU time but the hypervisor gave it elsewhere. Persistent steal is evidence of contention. For node work, that is not background noise. It is lost service capacity.
- Thermal and frequency consistency at the host level.
VPS operators rarely expose full physical telemetry. That is the point. You cannot verify everything. Compensate by benchmarking at different hours and watching variance.
- Single-core performance when the client is not perfectly parallel.
Many node clients have bottlenecks in networking, database writes, proof generation, or task orchestration. More cores do not always solve the slow path.
- Headroom during routine maintenance.
Log rotation, compaction, snapshot verification, Docker pulls, and client updates consume resources. A node that runs at 85–95% CPU under normal service has no reserve.
A practical CPU audit is simple. Run the node in a staging window. Add synthetic load that approximates peak protocol behavior. Track CPU usage, load average, steal time, and response latency. If any metric degrades sharply before the VPS reaches nominal capacity, the plan is oversold or undersized.
CPU Sizing Matrix
| Node type | Minimum posture | Better posture | Failure indicator |
|---|---|---|---|
| Lightweight telemetry node | Shared CPU may run, but margin is thin | Dedicated low-core VPS | Heartbeat jitter during host load |
| Bandwidth-sharing node | Dedicated CPU preferred | Dedicated cores with low steal | Throughput drops during peak hours |
| Storage proof node | Dedicated CPU plus fast disk | Dedicated cores with NVMe | I/O wait and proof delays |
| AI-compute / GPU-adjacent node | Dedicated CPU required | Dedicated CPU, high RAM, verified network | Job failures, assignment loss, latency spikes |
The cost-to-yield ratio must include penalties. A $20 VPS that misses reward windows is not cheaper than a $60 VPS that stays eligible. It is just underreported loss.
Latency and Throughput: The Network Layer Decides Eligibility
Many DePIN operators test bandwidth once and stop. That is insufficient. A single speed test measures one route at one point in time. DePIN service quality depends on sustained throughput, packet stability, regional proximity, and latency during network congestion.
For many DePIN workloads, sub-50ms latency is a practical target. It is not a universal law. It is a useful threshold because networks such as compute marketplaces, decentralized bandwidth systems, and service-verification protocols tend to reward nodes that respond quickly and consistently. Above that range, the node may still function, but competitive positioning deteriorates.
A bandwidth-sharing node also needs a different network profile than a lightweight validator-style service. The port speed and transfer policy matter. For serious DePIN bandwidth workloads, 1Gbps+ network speed and unmetered bandwidth are the baseline posture. Metered plans create a hidden liquidation point. The node can become uneconomic before it becomes offline.
Audit the network in four layers.
1. Port speed.
Confirm whether the VPS has a 1Gbps or higher interface. Then test real throughput. A listed port speed is a ceiling, not a guarantee.
2. Monthly transfer policy.
“Fair use” language is not the same as unmetered bandwidth. Read the abuse and throttling terms. If the provider can silently reduce throughput after a threshold, model that as a failure condition.
3. Latency to relevant regions.
Test against the geography where the protocol assigns jobs, validates service, or routes traffic. A node in the wrong region can be technically healthy and economically weak.
4. Packet loss and jitter.
Low average latency is not enough. Spikes break service windows. Measure jitter over hours, not seconds.
The operator should run continuous probes. Ping is crude but useful. MTR is better for route instability. Application-level probes are best because they measure the path the node actually uses.
For broader operational discipline, infrastructure operators can borrow from non-crypto system administration habits; even general practical resources such as everyday technical and life guidance are useful reminders that stable routines beat improvised reactions. The same principle applies here. Measure continuously. Do not rely on a one-time setup test.
Network Audit Targets
| Parameter | Practical target | Why it matters |
|---|---|---|
| Latency | <50ms to relevant service endpoints where possible | Reduces missed response windows and improves service score |
| Port speed | 1Gbps+ for bandwidth-heavy nodes | Supports sustained delivery and retrieval |
| Transfer | Unmetered or explicitly high allowance | Avoids throttling that mimics downtime |
| Packet loss | Near zero under normal operation | Prevents proof and job failures |
| Jitter | Low and stable over long windows | Protects time-sensitive verification |
The dangerous configuration is a node that looks healthy from the VPS control panel but fails protocol-level network checks. Provider uptime is not node uptime. Provider bandwidth is not delivered service. Treat them separately.
Disk I/O and Storage Integrity: Proof Systems Punish Slow Storage
Storage DePIN networks are less forgiving than operators expect. The bottleneck is not only capacity. It is access speed, write consistency, and proof responsiveness.
Filecoin-style and Storj-style storage workloads rely on the node’s ability to store, retrieve, and prove data. Proof-of-spacetime and retrieval checks are service obligations. Slow disk can become equivalent to missing data if the proof cannot be generated or delivered inside the expected window.
This is why NVMe SSDs are the correct default for high-throughput storage nodes. SATA SSDs may work for some lighter workloads. HDDs are often cost-efficient for raw capacity, but they introduce seek latency and I/O queue risk. The correct choice depends on the network. The audit principle does not change: capacity without IOPS is a false asset.
Disk evaluation should include:
- Random read IOPS.
Proof and retrieval workloads are not always sequential. Random access matters.
- Random write IOPS.
Databases, logs, metadata, and chunk writes can saturate cheap storage.
- I/O wait under node load.
High iowait means the CPU is idle because storage is too slow. The node appears underutilized while service degrades.
- Disk queue depth.
Persistent queues mean operations are backing up. This is a pre-failure signal.
- Filesystem and database behavior.
Node clients often use embedded databases or content-addressed storage. Corruption risk rises when the VPS is killed during writes or starved during compaction.
- Snapshot policy.
VPS snapshots can create I/O pauses. Provider backups can do the same. Schedule them outside critical windows where possible.
A storage node should be benchmarked before production. Use fio or equivalent tools to measure random read/write performance. Repeat tests during different provider load periods. A single clean benchmark after provisioning is not enough. Oversold storage can degrade at peak host usage.
Raw terabytes do not earn storage rewards. Timely proof delivery does.
There is also a subtle accounting problem. Operators often price storage by monthly VPS cost per terabyte. That misses three items: IOPS class, egress policy, and recovery time. If a disk volume fails or a provider throttles I/O, the economic damage includes missed rewards, possible penalties, and rebuild time. The cheap disk becomes expensive after the first proof failure.
RAM Headroom and Process Stability: Preventing Self-Inflicted Downtime
RAM failures are less dramatic than disk failures. They are more common.
A node process under memory pressure may not crash immediately. It may swap. It may slow down. It may trigger garbage collection more often. It may fail during database compaction. Eventually the kernel’s OOM killer may terminate the wrong process. From the protocol’s perspective, the cause is irrelevant. The node failed service.
The minimum RAM published by a project should be treated as boot capacity, not production capacity. Production sizing needs overhead for:
- The node client.
- Database cache.
- Docker or container runtime overhead.
- Monitoring agents.
- Log buffers.
- OS processes.
- Update and snapshot operations.
- Temporary spikes during proof generation or job execution.
Swap is not a solution. Swap is a damage-control mechanism. On NVMe, it can prevent immediate death. It can also turn a fast failure into a slow protocol miss. On storage nodes, heavy swap competes with proof I/O. On compute nodes, it destroys execution latency.
A pragmatic RAM policy:
1. Keep normal memory usage below 70% during steady state.
2. Alert at 80%.
3. Treat sustained swap activity as a production incident.
4. Track process-level RSS, not only system-wide free memory.
5. Restart only with controlled automation. Blind restart loops can corrupt state or trigger longer downtime.
If the node uses containers, set resource limits deliberately. Unlimited containers can starve monitoring and system services. Limits that are too tight can kill the node during spikes. The correct setting is tested under workload, not copied from a forum.
Proactive Node Health: Prometheus and Grafana Are Not Optional Decoration
Monitoring is often installed after the first penalty. That is backwards. Monitoring is part of the infrastructure spec.
Prometheus and Grafana are standard because they separate measurement from display. Prometheus scrapes metrics. Grafana turns them into dashboards. Alertmanager or equivalent tooling sends alerts before the node crosses the failure boundary. The exact stack can vary. The requirement does not: the operator needs real-time visibility into resource saturation and protocol health.
A minimum DePIN node dashboard should expose:
- CPU usage by core.
- CPU steal time.
- Load average.
- RAM usage and swap activity.
- Disk utilization.
- Disk I/O wait.
- Disk read/write latency.
- Network throughput.
- Packet loss or probe failures.
- Node process status.
- Peer count or service connectivity.
- Proof submission success or failure.
- Block height, task height, or protocol-specific sync status.
- Uptime over rolling 24-hour, 7-day, and 30-day windows.
The uptime target for optimal reward tiering is commonly >99.9%. That means the monthly error budget is small. Roughly 43 minutes per 30-day month. Maintenance, crashes, provider incidents, and misconfiguration all spend from the same budget.
A monitoring configuration without alert thresholds is a log archive. It is not a control.
Practical Alert Thresholds
| Metric | Warning | Critical | Operator action |
|---|---|---|---|
| CPU usage | >75% for 10 minutes | >90% for 5 minutes | Identify process load, scale plan, reduce non-node tasks |
| CPU steal | >3% sustained | >8% sustained | Move to dedicated cores or different host |
| RAM usage | >80% | >90% or swap active | Increase RAM, tune cache, inspect leaks |
| Disk usage | >75% | >90% | Expand volume before writes fail |
| I/O wait | >10% sustained | >20% sustained | Benchmark disk, reduce competing I/O, migrate to NVMe |
| Latency | Above target for 10 minutes | Repeated spikes beyond proof window tolerance | Test routes, change region, change provider |
| Node process | Restart event | Repeated restarts | Stop automation loop, inspect logs |
| Uptime | Below 99.95% rolling | Approaching 99.9% breach | Freeze maintenance, investigate instability |
The key is not the exact number in every row. The key is pre-failure detection. By the time a protocol marks a proof missed, the infrastructure failure has already matured.
Provider Selection: What the VPS Sales Page Does Not Tell You
A VPS provider can meet the written specs and still be a poor DePIN host. The missing data is usually contention, throttling policy, storage backend design, and maintenance behavior.
There is no public, reliable blacklist of VPS providers that consistently fail DePIN workloads. Avoid anyone claiming one as fact. Conditions change by region, node type, host density, and plan class. The audit should be performed against the specific plan in the specific region.
Evaluate the provider against operational questions:
1. Are CPU cores dedicated or shared?
If shared, assume performance variance. If dedicated, verify through sustained benchmarks.
2. Is bandwidth truly unmetered?
Read the acceptable use policy. Watch for fair-use throttling, egress caps, or vague abuse enforcement.
3. What storage type is attached?
“SSD” is not enough. NVMe is preferred for high-throughput storage nodes. Benchmark IOPS.
4. Does the provider announce maintenance?
Unannounced host reboots can convert into missed proof windows.
5. Can the VPS be resized without long downtime?
Scaling should not require a manual rebuild unless the protocol tolerates downtime.
6. Is the region close to relevant network activity?
Cheap distant compute can lose to slightly more expensive local compute.
7. Does the provider permit the workload?
Some providers restrict crypto, mining-like behavior, high bandwidth services, or unusual traffic patterns. DePIN is not always classified cleanly.
8. Can you export backups and migrate quickly?
A provider lock-in event is an uptime risk.
Budget VPS plans are not automatically invalid. They are invalid when used without verifying IOPS, CPU contention, bandwidth caps, and latency. That is the distinction. The protocol does not care that the invoice was efficient.
A Hard Audit Procedure Before Mainnet Funds Are Exposed
A DePIN node should not move directly from installation to revenue assumptions. It needs a burn-in period. The burn-in is not ceremonial. It finds variance.
Run this procedure before staking, bonding, or exposing meaningful capital to slashing conditions.
1. Extract the protocol’s actual penalty conditions.
Identify downtime thresholds, proof failure rules, service score mechanics, and malicious behavior definitions. If formulas are not public, mark that as unknown risk.
2. Map each condition to a VPS metric.
Downtime maps to process health and network reachability. Proof failure maps to disk, CPU, and latency. Job failure maps to CPU, RAM, and bandwidth.
3. Benchmark the VPS before installing the node.
Measure CPU, disk IOPS, memory behavior, and network throughput. Save results. They are the baseline.
4. Install the node with monitoring from day zero.
Do not add Prometheus later. The first synchronization or proof cycle is already useful test data.
5. Run at least one full workload cycle.
For storage, include proof and retrieval behavior. For compute, include job execution. For bandwidth, include sustained transfer.
6. Simulate routine maintenance.
Update packages. Rotate logs. Restart services. Take a snapshot if the provider uses snapshots. Watch whether the node misses obligations.
7. Observe peak-hour variance.
Test during different times of day. Oversold hosts often reveal themselves when neighbors become active.
8. Set alerts below protocol failure thresholds.
If the network penalizes at missed proof, alert before proof latency gets close. If uptime tiering breaks at 99.9%, alert before the rolling window is threatened.
9. Document migration steps.
Know how to move keys, databases, and configuration. Improvised migration during an incident is how small outages become slashing events.
10. Only then allocate capital.
If staking or bonding is required, the infrastructure should already have survived burn-in.
This is the difference between node operation and node gambling.
Common Misconfigurations That Look Like Hardware Problems
Not every failure is caused by bad VPS specs. Some are operator errors that mimic resource exhaustion.
The usual suspects:
- Time drift.
Broken or missing NTP can create invalid timestamps, failed handshakes, or consensus issues.
- Closed ports.
The node runs locally but cannot receive required inbound traffic.
- Stale client version.
Protocol changes can make an old node non-compliant.
- Aggressive firewall defaults.
Provider-level firewalls can override local configuration.
- Docker logging left unbounded.
Logs consume disk until the node fails writes.
- Single disk for OS, logs, database, and proofs.
Competing I/O creates avoidable bottlenecks.
- Automated updates without maintenance windows.
A random reboot is still downtime.
- No separation between hot keys and operational scripts.
A compromised VPS can become more than a downtime event. It can become a key-loss event.
These are not advanced failures. They are routine. They also cause real penalties.
The Final VPS Spec Is a Risk Budget, Not a Shopping List
The correct VPS for a DePIN node is not the one with the largest headline number. It is the one with the lowest variance under the protocol’s service obligations.
A defensible baseline looks like this:
| Component | Conservative baseline |
|---|---|
| CPU | Dedicated cores for serious compute, storage, or bandwidth workloads |
| RAM | Enough to keep steady-state usage below 70% |
| Disk | NVMe SSD for high-throughput storage or proof-heavy nodes |
| Network | 1Gbps+ where bandwidth matters; unmetered or clearly sufficient transfer |
| Latency | <50ms to relevant endpoints where practical |
| Uptime | Operated to preserve >99.9% rolling availability |
| Monitoring | Prometheus/Grafana or equivalent with actionable alerts |
| Recovery | Documented restart, restore, and migration procedure |
There is no claim here that any VPS provider guarantees immunity from slashing. That claim would be false. Slashing exposure comes from the interaction between protocol rules, operator behavior, and infrastructure variance.
The binary verdict is simple.
If the VPS uses shared CPU, unknown disk IOPS, metered bandwidth, no continuous monitoring, and no tested recovery path, it is not production-grade for DePIN yield. It is a test box.
If the VPS has dedicated compute, benchmarked NVMe performance, stable sub-50ms network paths where required, 1Gbps-class bandwidth for traffic-heavy nodes, alerting before saturation, and a documented migration plan, it is eligible for production consideration.
Not safe. Eligible. In DePIN infrastructure, that distinction is the audit.